Analytics Tools And Techniques For Pentesting iOS Application.
16 April 2022As part of our series of articles on pentesting in iOSapplications , this time we learn about some analysis tools and techniques from a theoretical and practical approach.
Table of Contents
Introduction
In previous articles we have mentioned the dynamic and static analysis approach , we have raised issues related to the methodological bases of iOS application analysis and we have also mentioned, for example, the guides offered by the OWASP organization. But this time we will analyze different analysis approaches in order to specify some techniques and tools that will help us with the audit of our applications.
Entering the analysis surface
As we have mentioned in this series of articles on pentesting in iOS applications , we have managed to install a study application and some tools that would suggest that it only remains to start with the analysis tests, but following the principle of the different hacking analysis methodologies. Ethically, one of the first tasks that we must carry out before starting with penetration tests is to carry out a reconnaissance process on our analysis objective.
For any application, this process is essentially based on using the application that we need to analyze in order to understand how it works and thus generate a “mapping” that will later serve us to carry out our analysis tests with a more rational sense, minimizing the results of any automated test type.
Our objective will be to understand the operation of the app at the user level (essential task that will later allow us to decide whether or not we can execute, for example, an attack to escalate privileges), to understand the logic, the architecture, the provision of users and privileges. , the flow of communication between application objects, when communication with a server occurs, paying special attention to application events (application logic problems, character limits in forms) and its general infrastructure.
In addition to other information that we can obtain from the normal use of the app, this task of using the application and observing its operation is radical to understand the context of our analysis surface. Then, we will complement all the information that we collect with the information that we will obtain from the class dump when we analyze the application binary —we will talk about this later and about all the debugging tools that we can use to analyze the behavior of the application. .
Undoubtedly, this entire process allows us to obtain a fairly complete mapping of our application, which will allow us to establish with greater precision what the attack surface with which we will work will be. For this process it is important to be organized. For example, using schemes and flowcharts that help organize the information that we are relating.
Although this type of test does not apply to the study app that we have installed because it is designed for academic purposes, it is important to keep in mind how fundamental this stage is, since from there we can run from any automated test and be precise in the tests we need to run.
Once we have tested our study application and we have managed to organize the collected information schematically, we have various paths that will provide us with information about our objective. These are paths that we will have to go through to carry out the tests suggested by various organizations such as OWASP, although the most logical thing once the application has been tested would be to continue analyzing the application installed on the device. This involves aspects such as binary analysis and runtime analysis, among others.
In this opportunity we will propose to walk the path from what we can consider the most external layer of the application (network layer) to the most internal layers. Also considering the analysis of the application installed on the device with its various aspects, something that we will analyze in other entries.
Next, we go through the most relevant aspects that we must consider when executing our audits on the network layer together with some analysis tools.
traffic analysis
Well, within the traffic analysis, without a doubt, our objective will be to capture sensitive information and detect possible vulnerabilities in communications, although when auditing our application we must consider certain points; for example, differentiating between traffic generated during application installation and traffic generated while using the application. It is possible that there is data in transit during the installation of the application that later does not exist during the execution or use of the application. For this reason, it is preferable to make two different captures of traffic, making a capture when we install the application for the first time and another when we use the application.
These captures can usually be done by using tools like tcpdump or Wireshark. From the captures we will obtain .pcap files that we will later analyze statically to search for relevant information in them.
Another important point that we must consider is that not all the traffic of an application goes through http or https . It could be the case where other ports and services are being used to establish communications.
Regarding the analysis of web traffic, it will be convenient to carry out traffic interception tests with tools such as ProxyWeb, for which we have tools such as Zap or Burp Suite, which require us to use trusted certificates in the device to be able to intercept traffic.
Both the captures that we make with tcpdump and the traffic that we manage to capture through the use of web proxies, both will give us even more information about our attack target. In this way we will be able to know, for example, which servers our application connects to and through which services, and in this way we would be expanding our attack surface, being able to add new analysis objects and greater understanding of the application to our application mapping diagram. same.
Traffic capture and analysis with TCPDUMP
As we have mentioned before, it will be very important to be able to capture all the traffic that is generated when we install the application that we want to analyze, as well as the traffic that is generated when we use it. Although we can use various tools for this, we will see how we can carry out this process using the tcpdump tool, which allows us to capture all the traffic that runs on our device.
Before getting to work on capturing packets directly from iOS, it is important to keep in mind that we will need to put our device’s network card in monitor mode and this is initially a problem, since as a preventive measure Apple does not allows this function. However, there are several external tools that allow you to change the status of the network card, although they require us to jailbreak the device .
In this case we will discard the use of external tools and the functionality of the promiscuous mode in the interface of our device. We will use our Mac as an interceptor of the packets that our iOS sends or receives by creating a virtual interface so that we can later analyze the captures obtained.
In order to create the virtual interface on our Mac, the first step will be to identify the UDID of our device. To do this we will connect our device via USB to the Mac, then we open iTunes, navigate to our iOS information, and in the general section we will find the identifying elements of the device, as seen in the image below:
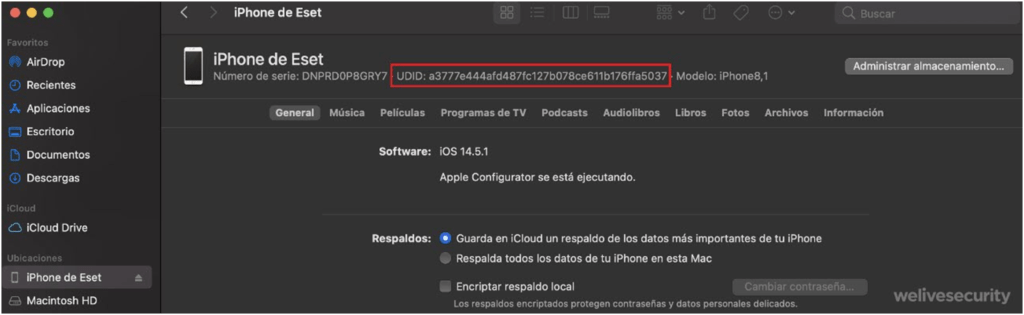
Getting UDID
Note: If the UDID does not appear at first, we can click on the numbers of the last label and it will show different values, including the UDID.
Once the UDID of the device is obtained, we will use this identifier to create a virtual remote interface and through it carry out the capture of the packets. This virtual network interface that we are going to create will represent the network interface of the iOS device through which all the packets that we are interested in capturing will pass. To do this, we open the terminal and write the command rvictl -s <UDID> that is seen in the following image:
Creating virtual interface
Creating virtual interface
Note: In order to run rvictl we need to have the Xcode Command Line Tools installed
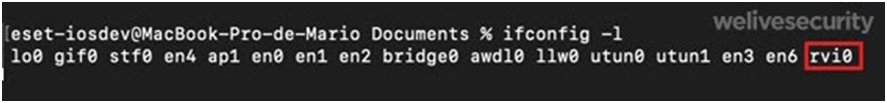
As we can see in the image, the interface of the device whose UDID we have indicated is created in the output of the command. To verify that the interface was successfully created we can list the network interfaces using the command ( ifconfig -l ) shown in the following image.

Verifying the creation of the virtual interface
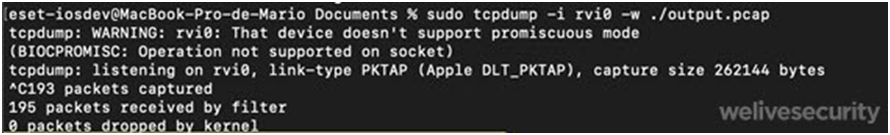
Once we have our interface configured, all that remains is to start capturing traffic and for this we will place the following command ( sudotcpdump -i revi0 -w ./output.pcap ) as shown in the following image.
Starting traffic capture
Developing a little more the syntax that we have placed previously, we must mention that with the -i option we are telling tcpdump in which interface we want to listen (in our case it is rvi0 , which is the one that we have previously created with the UDID of the device), and the -w parameter specifies the path and name of the directory where we want to save the capture that we are going to make.
If we observe in the image, after executing the command, the capture of the device packets begins, showing on the screen the weight of the capture file. In this way, everything we do on the device will be recorded in the capture file. To finish the capture, all you have to do is press Ctrl+C and it will stop, throwing the results in a file with a .pcap extension that, as we said, we can then analyze statically. On the other hand, it is important that when we finish capturing the packets we do not forget to eliminate the remote interface that we have created. For that we can help ourselves with the command ( rvictl -x <UDID> ) that is shown in the following image:

removing virtual interface
As we can see in a practical and simple way, with this tool we can make traffic captures that involve absolutely the entire communications ecosystem where we are analyzing our application and, nevertheless, we have the possibility of carrying out these analyzes repeatedly, since we have a sample of the capturing traffic that we can manipulate at our disposal. If we look at the following image we see the capture file that we have obtained open with Wireshark in which different search options are shown such as Regular expression, Strings, Hex Value and other tools that we can use to find relevant information within the capture made.
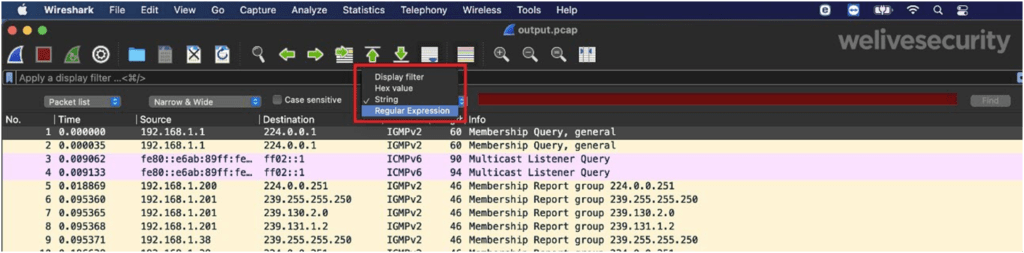
Opening Outout.pcap by using Wireshark
Capture and analysis of traffic with WebProxy (Burp)
Continuing with the interception and analysis of traffic, at this point we will see how to intercept traffic through a WebProxy, which will allow us to execute a classic “man the middle” attack to intercept traffic that is encrypted. Although there are several tools to achieve this technique, we must highlight the effectiveness of mitmproxy, which has extensive documentation and, as we see in the following image, offers us an operating scheme of the type of proxy (RegularProxy) that we will need to use to carry out carry out these types of interceptions.
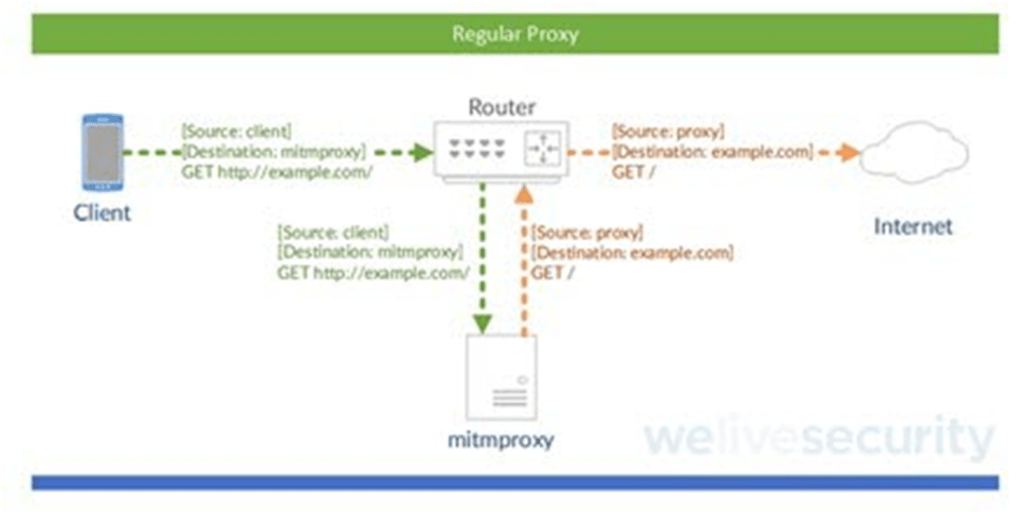
RegularProxy scheme (Classic MITM). Image source: mitmproxy
As we mentioned before, there are various tools that allow us to carry out this technique of intercepting encrypted traffic and then we will see how to do it using the BurpSuiteWebProxy, which consists of a professional version and another community version that we can download from the following link and includes various tools to manipulate traffic.
As we will see later, this type of tool will force us to add a certificate to our device in order to carry out the various interceptions that we need to carry out. These types of tools (WebProxy), among which we can highlight BurpSuite, mitmproxy or Zap, are very powerful since they allow us to modify queries and perform detailed analyzes on specific cases and bring various functionalities such as vulnerability scanning, crawlers and automation tools , among other.
Once BurpSuite is installed on our Mac, the first thing we will do is review our network configuration in order to find our IP address using, for example, the ifconfig command ; as shown in the following image.
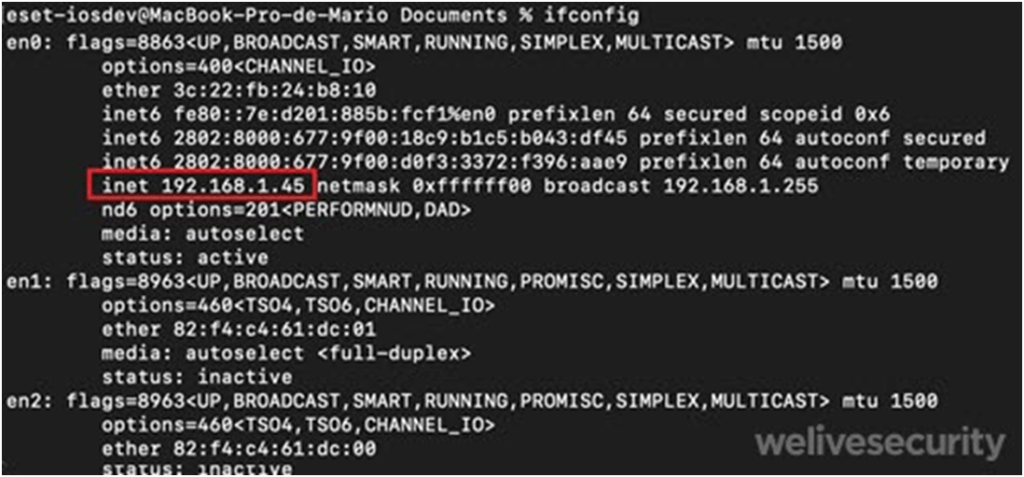
Looking for our IP address
Once we know what our IP address is, we will open Burp, then we will look for the Proxy tab , Options , and click on Edit, as shown in the following image. Here we will specify in the port the number Blind to port 8080 and in specific address our IP address. Then we click OK.
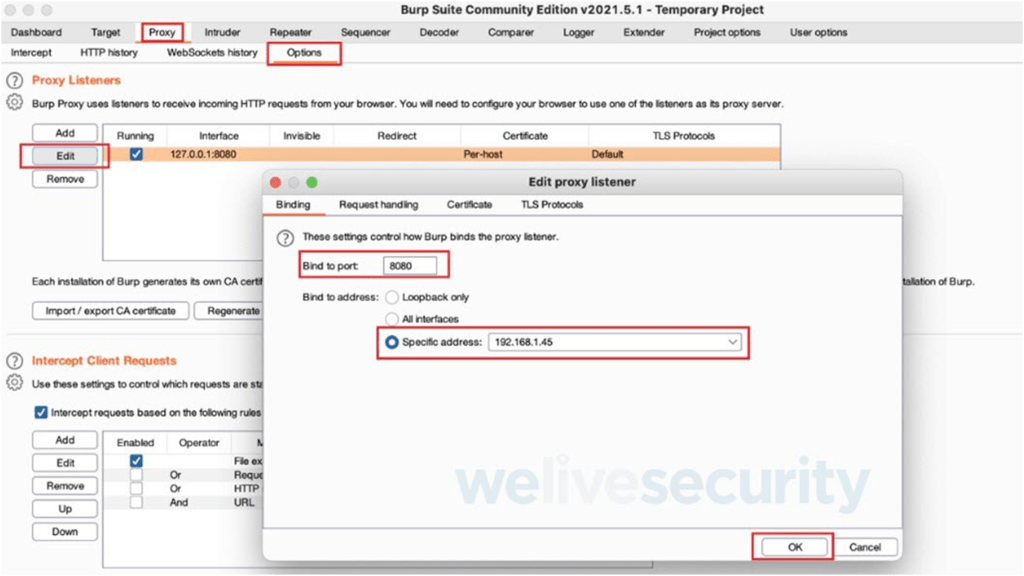
Configuring the proxy in Burp
Once the configuration is created in Burp, we will take our device and go to the configuration of our wireless network and we will see an option called “ configure proxy ”, as shown in the following image:
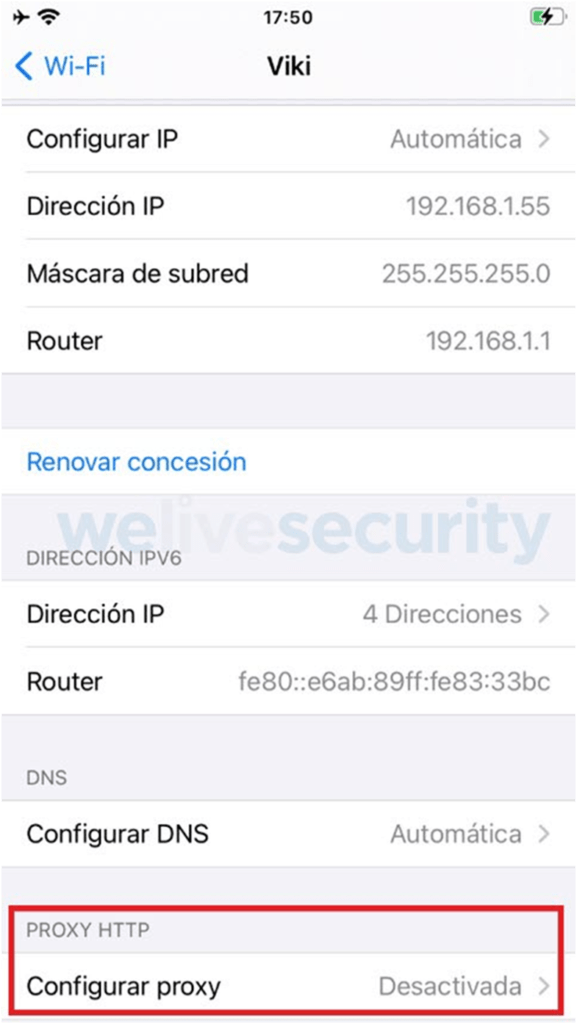
Wireless network options on the device
Once entered the proxy configuration menu, we will place where it says Server the IP data where we have Burp installed and we will indicate the port number which, as can be seen, in this case is 8080.
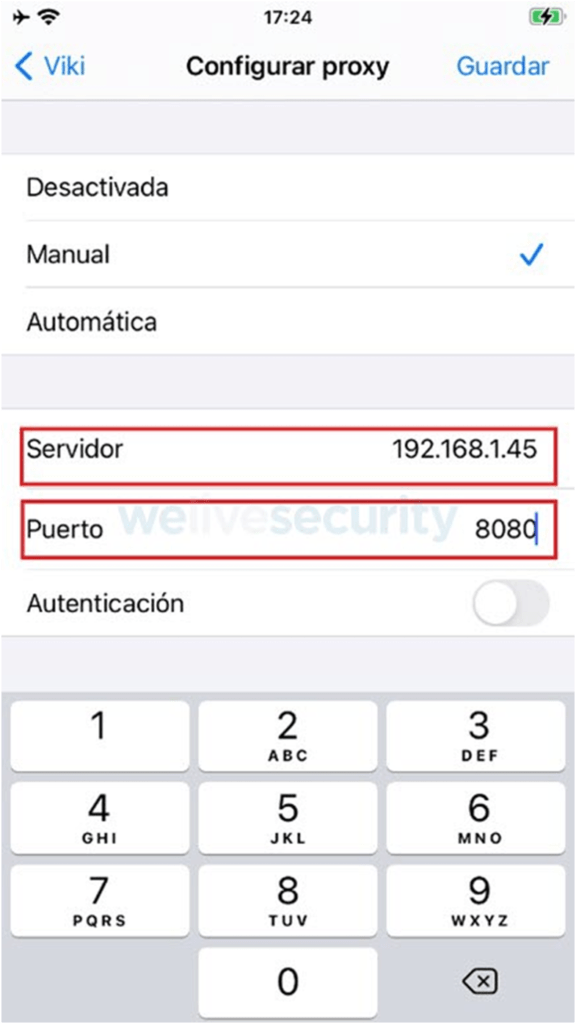
Configuring the proxy on the device
Once the proxy configuration changes are saved, we will enter the safari browser and place the URL http://burp , as shown in the image.
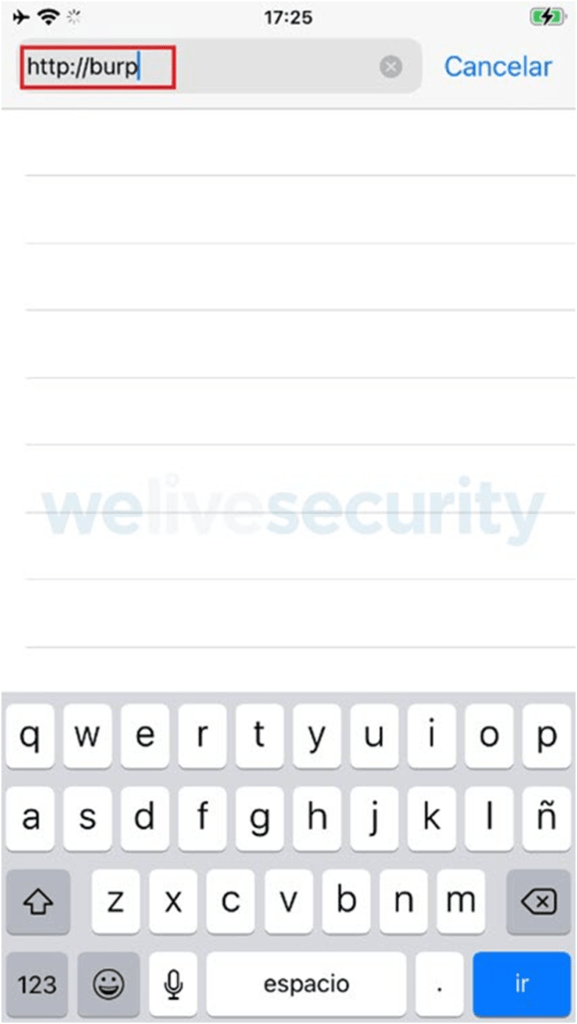
Entering Burp to download the certificate
If we look, a website opens from which we can download the trusted certificate that we will need to intercept the encrypted connections. In the upper right part we see a button called CA Certificate , as shown in the following image, on which we must click to download the certificate.
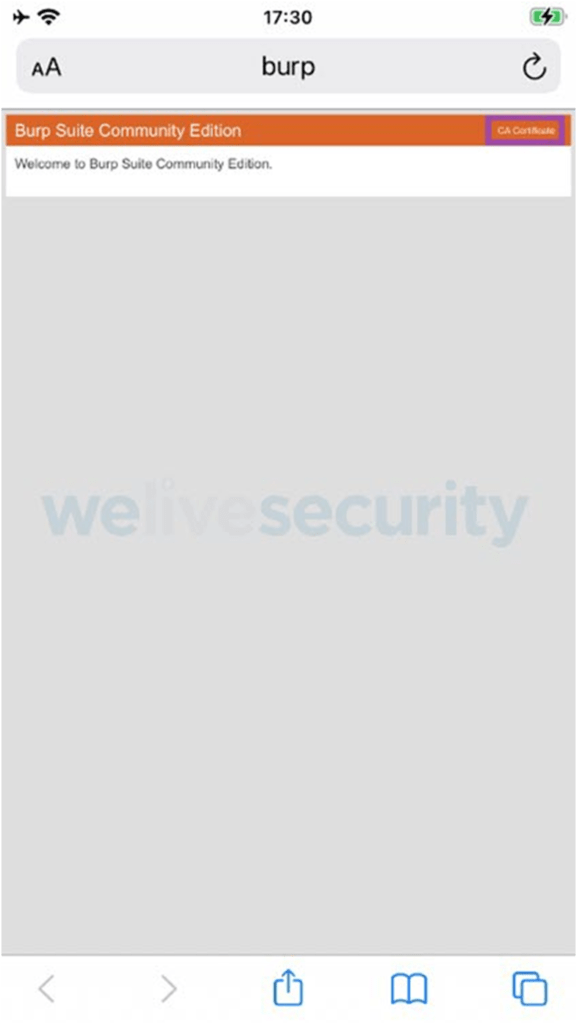
Certificate Download
After pressing the certificate button, a message appears warning us of downloading the certificate and we must choose the allow option.
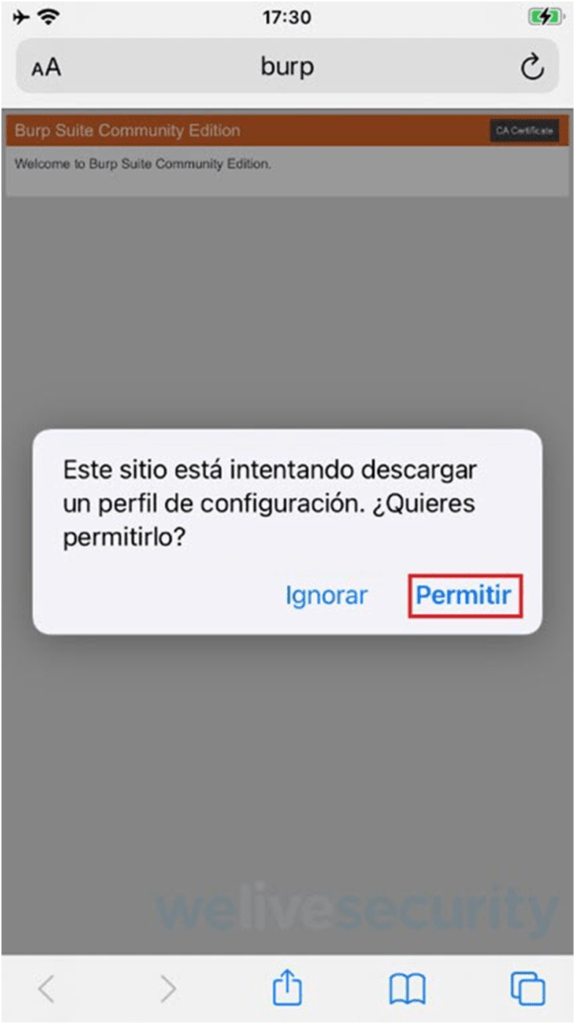
Accepting the certificate download warnings
Certificate downloaded
Then we proceed to install the trusted certificate that we downloaded. Of course we can do this because we have our device jailbroken, otherwise we could only see http traffic.
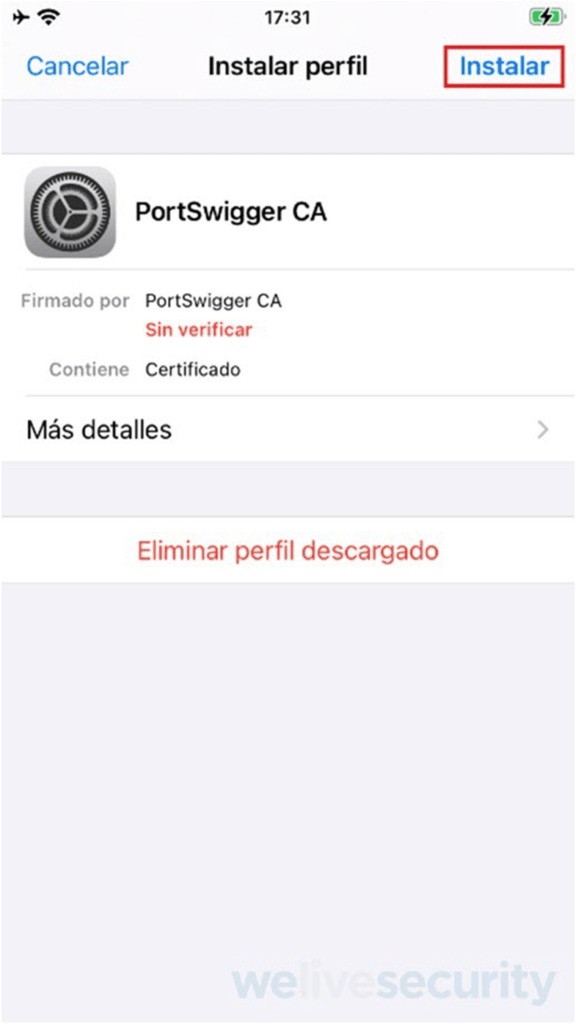
Certificate Installation
Certificate Installation
Now, we already have the proxy configured both on our PC and on our device. Now it’s time to intercept https traffic and view its content. For this example we will enter the https://apple.co m site from our device and capture this traffic from the burp proxy installed on our PC.
Entering the apple.com site via HTTPS
As we can see in the following image, once we enter the site via https , the proxy automatically intercepts the connection.
Sample of the traffic intercept captured by Burp
If we look at the description of the intercepted traffic, we clearly see the headers used and the query parameters. In this case, the example is simple, but we could well intercept the login of an application and see, for example, how the parameters of the credentials travel, among other aspects.
All the interception tests that we carry out will undoubtedly be complementary to the mapping of the application that we have carried out initially. We have said that as we gain information from our application, it is likely that we will increase our attack surface, giving rise, for example, to the detection of various servers and services used by the application, since at this point our objective will be to analyze the open ports. and published services (both TCP and UDP), as well as the analysis of the existence of IDS/IPS/WAF systems and attempts to bypass them or possible web-type vulnerabilities that we can detect.
There are applications that use, for example, the webview module, where many GET -type requests are made that connect with various APIs and here it is likely that we can find typical vulnerabilities in web applications ( XSS , CSRF, etc.) or infrastructure (SSL, headers, etc). For this type of task, the use of tools such as the Burp or Zap web proxy is essential, which, as we have already said, allow us to deploy analysis techniques in order to detect vulnerabilities in a very efficient way.
At this point where the attack surface can grow radically, there are cases in which it is necessary to carry out parallel audits and outside the analysis of our application. Although this would increase the scope of analysis, it would divert us from our focus of study and on the other hand it would take too much time.
SSH tunnels and other communications with the device
On many occasions it will happen that we need to communicate with the device preventing this communication from being made through the Internet. In these cases, SSH tunnels are very useful and we will see below how they are implemented using the itnl and iproxy tools.
tunnel via itnl
To use itnl we will download the tool . Once the file is downloaded, we unzip it and open the unzipped directory in the terminal, to execute the script using the syntax shown in the following image:
Setting up the SSH tunnel via itnl
As can be seen, the script detects the device connected to our computer and tunnels the connection.
Below we can see how we managed to connect to the device through the tunnel that we have created by means of the sshroot@localhost -p 2222 command .
Testing SSH connection to the tunnel created with itnl
Note: Remember that the default password for the ssh service is “alpine”, which we must change for greater security.
As we can see, the procedure to establish the tunnel is very simple and we will see the same thing that happens next with the implementation of iproxy.
Tunnel via iproxy
We proceed to download the tool from the following link and, as we have done with itnl, once we download the tool we decompress the file and open the directory where the file is in the terminal to carry out the execution of the script using the syntax that is see in the following image:
Setting up the SSH tunnel via iproxy
As we can see, the tool detects the device connected to our computer and tunnels the connection, giving us the possibility, as seen below, of connecting to the device via SSH through the established tunnel.
Testing SSH connection to the tunnel created with iproxy
Note: Remember that the default password for the ssh service is “alpine”, which we must change for greater security.
Although the creation of these types of tunnels allows us to communicate and manipulate information on the device, there are other tools to communicate with the device and be able to manipulate information that include viewing detailed information, installing applications and other tasks. We can mention, for example, iExplorer , iFunBox or AppleConfigurator2 as graphical environment tools, and libimobiledevice libraries , which bring tools like ideviceinstaller , ideviceinfo , among others, that we can use from the terminal. They’re all really cool tools for communicating with the device and getting and manipulating information on the device.
debugging tools
Other analysis tools that are complementary in all the stages of an audit are those that allow us to debug and that allow us the possibility of searching for relevant information within the processes that we are executing. Although we have several tools that we could use next, we will see how to use the debugger tools that the Xcode IDE comes with.
As shown in the image below, we open Xcode, then open Windows and select “ Device and Simulators ”.
Opening the options of our device from Xcode
As the following image shows, we will see the details of our iPhone and three options, Take Screenshot , View Device Logs and Open Console ; all tools that allow us to obtain information about the device and the tasks that are executed on it, including the activities of the applications that are running.
Available options to view real-time information from our device
In the following image we see, for example, the output of the Open Console option , which, as its name indicates, is a console that shows the activity that takes place on the device and has a search option that allows us to filter the information What are we searching for. In the following example and after having executed the study application that we have installed (DVIA) we can see the search carried out by means of the application name filter.
Obtaining information by filtering search information by the word of the application name
All this information is very valuable, since although in this case we have carried out a simple search, we could execute more refined queries that allow us to monitor what is happening in each activity of the device and the application that we are using in order to relate events. or help us make decisions.
Conclusions
Although these techniques and tools that we have mentioned could be further explored and there will always be information left to mention, at least and schematically, different resources and considerations have been raised that we can use to work at the level of the traffic/network layer together with the tools debugger.
For the next deliveries we will address other resources that will help us analyze our application on the device, contemplating both the analysis of the iOS file system and the analysis of binaries and tests at runtime in order to cover all the analysis and In this way, we will have reference information on each of the analysis stages that we need to execute.