
HOW TO TRADE IN STOCK MARKET WITH ICHIMOKU?
31 May 2020Ichimoku Kinko Hyo, means in Japanese “the balance of graphics at a glance”. A difficult promise to keep in the face of markets responding to more and more short-term catalysts, mistreated or carried by the economic calendar, supported or under the vigilance of the largest central banks. For the purpose of optimal trading, it is important to maximize its timing of entry into position, while developing its timing of exit. The validity of the signals is therefore essential as well as the precision of the objectives and the time horizon that we set ourselves to reach our target.
Join stock market course in Delhi From DICC if you would like to implement this Ichimoku technique practically in the Live market hours.
In order to best respond to all of these issues, Ichimoku is based on three pillars: time theory, wave theory and price theory. These three pillars, combined with the so-called “traditional” signals, allow perfect control of stock price fluctuations and their future supports / resistance, by offering time objectives which complement the price objectives. However, the power of this tool cannot be fully exploited without a perfect mastery of the theoretical bases. The goal is therefore to lift the veil on this indicator which, despite its growing success, has managed to preserve a part of mystery, evidenced by this quote from its creator, Goichi Hosoda:
“Out of the 10,000 or so people who practice Ichimoku, only a dozen really understand it. “
Table of Contents
ICHIMOKU: WHAT IS THIS STOCK MARKET INDICATOR?
“Ichimoku Kinko Hyo”, commonly known as “Ichimoku”, is a method of technical analysis developed by Goichi Hosoda (1898-1982), a Japanese journalist specializing in financial markets, who, through his many years of market research, has set up this system to supplement the information available in Japanese candlesticks. More than 30 years after his death, Ichimoku is still widespread in Japan.
Although the Ichimoku is becoming increasingly popular with a growing number of investors around the world, much misunderstanding and false beliefs revolve around this system in the West. The causes of this finding are multiple.
First of all, Ichimoku is a set of theories and versatile analysis techniques, integrating among other things price projection, time projection and wave analysis. The wide variety of techniques and concepts included in Ichimoku’s theory makes mastering it very difficult. In addition, the language barrier further reinforces the mystery surrounding Ichimoku, since a faithful translation of Japanese literature on the subject requires a mastery of this system beforehand.
WHAT MAKES UP THE ICHIMOKU TRADING SYSTEM?
Before listing the various elements making up the Ichimoku system, it should be noted that all the principles discovered by Goichi Hosoda are based on a digital suite, the Hosoda suite:
9, 17, 26, 33, 42, 65, 76, 129, 172, 200
There is a mathematical link between each of these figures:
9 + 17 = 26.
26 + 17 = 42 + 1.
33 + 9 = 42.
33 × 2 = 65 + 1.
42 + 33 = 76-1.
65 × 2 = 129 + 1.
129 + 42 = 172-1…
Indeed, in his journey in search of the perfect tool to predict the evolution of stock market prices, Goichi Hosoda spent more than 4 years studying the main digital suites of the eastern and western world (including the suite of Fibonacci ). The first three digits of the sequence of Hosoda 9, 17, 26, represent the basis of the system itself, since they are used for the calculation of the different lines making up Ichimoku and are the foundation of number theory.
Ichimoku applies to Japanese candlestick charts and consists of five lines.
The Tenkan representing the average of the highest and the lowest over the last 9 periods. The Kijun , representing the average of the highest and the lowest over the last 26 periods. The Tenkan and the Kijun are traced in the present.
The Senkou Span A (SSA) represents the average of the Tenkan and the Kijun. Senkou Span B (SSB) is the average of the highest and lowest over the last 52 periods. SSA and SSB are projected 26 periods in the future (1 period). The cloud represents the gap between SSA and SSB.
The Chikou (Lagging span) corresponds to the closing prices, offset by 26 periods in the past (i.e. 1 period). Because of this, the Chikou is considered to be the market memory, but is also considered to be the “filter” of the Ichimoku system, for reasons that we will mention when we discuss the buy and sell signals of this system.
Thus, the belief that the number “9” (used in the calculation of the Tenkan) corresponds to a week of trading session in Japan (Saturday being included), is wrong. The same is true for the number “26” (used in the calculation of system components), which contrary to belief, makes no reference to a week of trading session in Japan.
INTERPRETATION OF ICHIMOKU COMPONENTS
The Tenkan represents the midpoints of the last nine periods (including the current period), the Kijun represents the midpoints of the last 26 periods.
These last two strongly resemble moving averages but are far from them. They could be related to “moving midpoints”. In Ichimoku theory, midpoints represent more relevant equilibrium points than moving averages. In the case of moving averages, only closing prices are taken into account.
Whatever the volatility or the evolution of prices during a given period, the closing price is the only element taken into consideration.
In other words, even if stock prices fluctuate considerably over a period, this volatility will not be reflected. Ichimoku therefore favors midpoints, reflecting the entire range of fluctuation over a predetermined period.
The cloud is used to determine the market trend. When the price is above the cloud, the market is considered to be bullish in the long term. When the price is below the cloud, the market is considered to be bearish in the long term.
The cloud also serves as long-term support in a bull market and long-term resistance in a bear market. A breakout of the cloud signals a change in the long-term market trend. A break above the cloud signals that the long-term trend has shifted from bearish to bullish. A break below the cloud indicates that the long-term trend has moved from an uptrend to a downtrend. The degree of thickness of the cloud also provides precious indications, and notably informs us about the strength of the support or the resistance it represents. When the cloud is narrow, it is considered weak as a support / resistance area. The courses could cross it with relative ease.
When the cloud is thick, it acts as a zone of support / major resistance. In a bull market, downward corrections very often stop in the cloud.
The same is true in a bear market, with upward corrections ending in the very confines of the cloud. Changes in the shape of the cloud provide useful insights into the current state of the market. Due to the interaction between the two lines that make up the cloud (SSA and SSB), its shape is constantly changing.
For example, we can regularly observe that when the cloud “twists”, following a crossing of the lines that compose it, the probabilities of a change of trend are relatively high, the crossing of the cloud being facilitated by these areas of weakness, more commonly known as cloud twist.
The interpretation of the lagging span is done through an analysis of its interaction with, among other things, the different elements of the Ichimoku system, but also everything around it and which would be likely to slow or stop its progression or its decline (a trend line, a chartist figure …).
The positioning of the lagging span in relation to current prices will also give us a valuable indication of the trend, because if the lagging span is under the price, the market is considered to be bullish, whereas if it is above the price , the market is bearish. Any change from an upward trend to a downward trend (or vice versa) requires crossing current prices, which will represent a major obstacle for “market memory”. Finally, lagging span also indicates the long-term trend due to its positioning relative to the cloud.
ICHIMOKU: BUY AND SELL SIGNALS AND POSITION MANAGEMENT
The first and most widespread signal comes to us when we cross the Kijun. A rise in the Kijun is a buy signal. Conversely, a crossing of the Kijun downward constitutes a sell signal. It is imperative to wait for the closing of the Japanese candlestick to estimate that the Kijun has been crossed, and therefore that we are facing a signal.
A second signal is provided to us when stock prices manage to exit the cloud: an exit from the top constitutes a buy signal, and an exit from the bottom will be a sell signal. Since the cloud represents market equilibrium, when prices break free, an imbalance is created, signaling a potential opportunity, the trader’s objective being to capture price imbalances.
Once a signal is provided, validation of the latter is required. This is when the “market memory”, the lagging span, will come into play. This will act as a filter and allow us to eliminate false signals.
A buy and sell signal will be validated when no obstacle is present on the way to the “lagging span” (either because no element is present in front of it at the time of the signal, or because the lagging span is managed to overcome the obstacles present in front of it at the time of the signal). It is only when it has crossed any obstacle (price, cloud, trend line, Tenkan and Kijun) that the signal will be validated and that entry into position can be initiated, because the movement initiated following the signal may now continue.
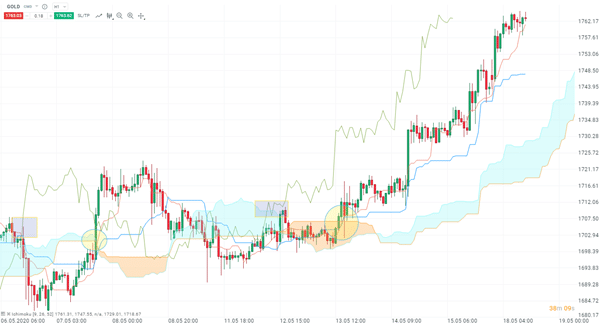
On this graph of the price of gold in hourly data, two signals can be identified (yellow ellipses) and their respective validations (blue rectangles). The first signal was provided when leaving the cloud from above (first yellow ellipse), and was validated (1st blue rectangle) when the lagging span cleared any obstacle by also leaving the cloud.
The second buy signal combines the two main signals provided by Ichimoku, namely the exit from the cloud and the crossing of the Kijun. The second blue rectangle highlights the validation of the signal following its exit from the top of the cloud.
The signals provided by the Ichimoku system are valid on any unit of time given the fractal nature of the markets. The imbalances highlighted can be exploited both in the long term and in the very short term. In addition, analysis over several time units may be preferred. Thus, a breakout of the Kijun on the daily, can represent a short-term opportunity, with the objective of the daily Tenkan, by intervening in an hourly time unit, even on lower time units for very short term trading (scalping ).
Ichimoku therefore stands out from traditional technical indicators and can be described as a system, given that it responds to all the problems encountered during the process of entering position, which allows it to be self-sufficient while benefiting from ‘great precision.
Disclaimer: All our information is, by nature, generic. They do not take into account your personal situation and do not in any way constitute personalized recommendations with a view to carrying out transactions and cannot be assimilated to a financial investment advisory service, or to any incentive to buy or sell instruments. The reader is solely responsible for the use of the information provided, without any recourse against the publisher of dicc.in being possible. The responsibility of the publisher of dicc.in can in no way be engaged in the event of an error, omission or inappropriate investment.