
What are Bollinger Bands? Discover one of the most used indicators for the graphical study of stock market prices.
Highlighted by John Bollinger in the early 1980s, it is probably the best known and most widely used volatility indicator in technical analysis. The current popularity of this indicator is first of all due to the ease with which it makes it possible to assess the volatility of a security and above all to specify the state of the market: in trend or in the trading range phase.
The second advantage of this indicator is that it makes it easy to find resistance support levels in a non-trending market and to detect when the market starts a new trend.
Learn complete and practical applicability of bollinger bands with stock market course in Delhi as offered by DICC.
Table of Contents
STOCK MARKET: WHAT ARE BOLLINGER BANDS?
Bollinger bands are made up of two lines which will frame the evolution of prices around their average. The primary objective is to supervise the evolution of prices according to the volatility of the market.
The basic principle of Bollinger bands is based on the normal law according to which, in 95% of cases, prices move between + / – 2 Standard deviation around the mean and in only 5% of cases, prices move out of this space fluctuation.
Thus, the Bollinger bands are constructed from a moving average of average prices, to which we add and subtract 2 standard deviations. This calculation is performed by your stock market software.
HOW TO INTERPRET BOLLINGER BANDS?
There are two possible interpretations for Bollinger Bands.
Interpretation in terms of volatility
When market volatility increases, we see increasingly strong price variations. The standard deviation will increase and thereby cause a widening of the Bollinger bands. Conversely, when market volatility weakens, we see increasingly small price variations. The standard deviation will shrink and thereby cause the Bollinger bands to narrow. These calculations are generally carried out by stock market and technical analysis software.
So, volatility is minimal when bands contract sharply and volatility is maximal when bands spread sharply. Any overflow of prices outside the two bands indicates a return of volatility. From this return of volatility, a new trend may emerge.
What needs to be understood is that low volatility means there is a temporary equilibrium between buyers and sellers.
When the “buy-sell” balance is upset and the value shifts up and down, volatility explodes and prices come out of the Bollinger bands. If it is the buyers who won the battle, prices will move out of the upper Bollinger band and vice versa if the sellers won the battle.
Thus, the signal to breach the Bollinger Band that arrives after a phase of low volatility (narrow bands) should be interpreted as the start signal of a new trend.
Interpretation in terms of resistance supports
It is the assumption that prices follow the normal law which allows the analysis of Bollinger bands in terms of support and resistance. The lower band represents a level of support and the upper band represents a level of resistance.
However, a nuance must be brought to this analysis. Indeed, when volatility is high, the Bollinger bands tend to fluctuate strongly from day to day. Thus, the level of support and resistance remains valid in the very short term (1 or 2 days for daily charts). On the other hand, when the market is calm and the bands are narrow, their use as a level of resistance support makes sense.
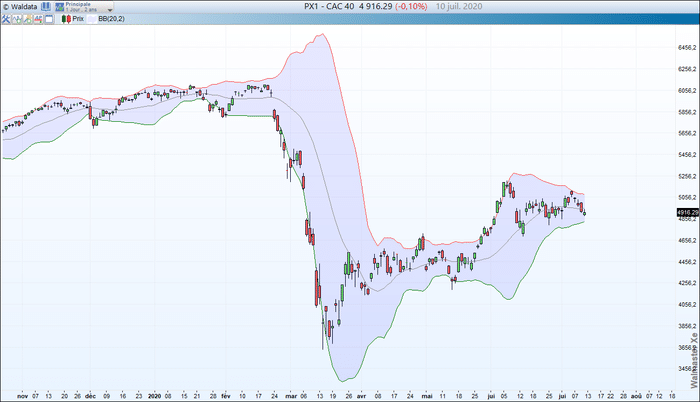
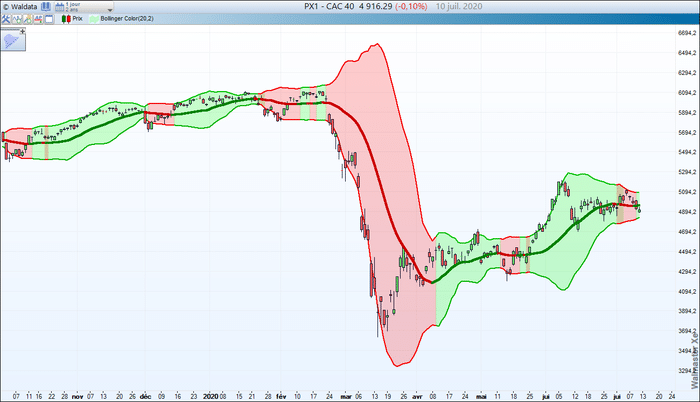
BOLLINGER BANDS: PRACTICAL CASE
As part of a practical application with Bollinger Bands, a method has been performed by Waldata as part of its AtExpert modules, allowing to perform automatic spotting of trend phases using synthetic analysis and of the most widely used volatility indicators of the same family such as Bollinger Bands, Bollinger Band Width, Keltner Bands.
This systematic method makes it possible to anticipate the end of the squeeze phase and the start of a strong acceleration. This allows the detection of input position signals and the complete monitoring of the open positions which are displayed on the graph when the signal is detected.
Bollinger tapes are used by investors and traders to do, among other things, their impulse trading and thus benefit from upward and downward market explosions.